Rent or Buy in Vancouver
Rent or Buy in Vancouver To Rent or Buy in Vancouver is a common question we receive from our buyers and it’s actually a really hard

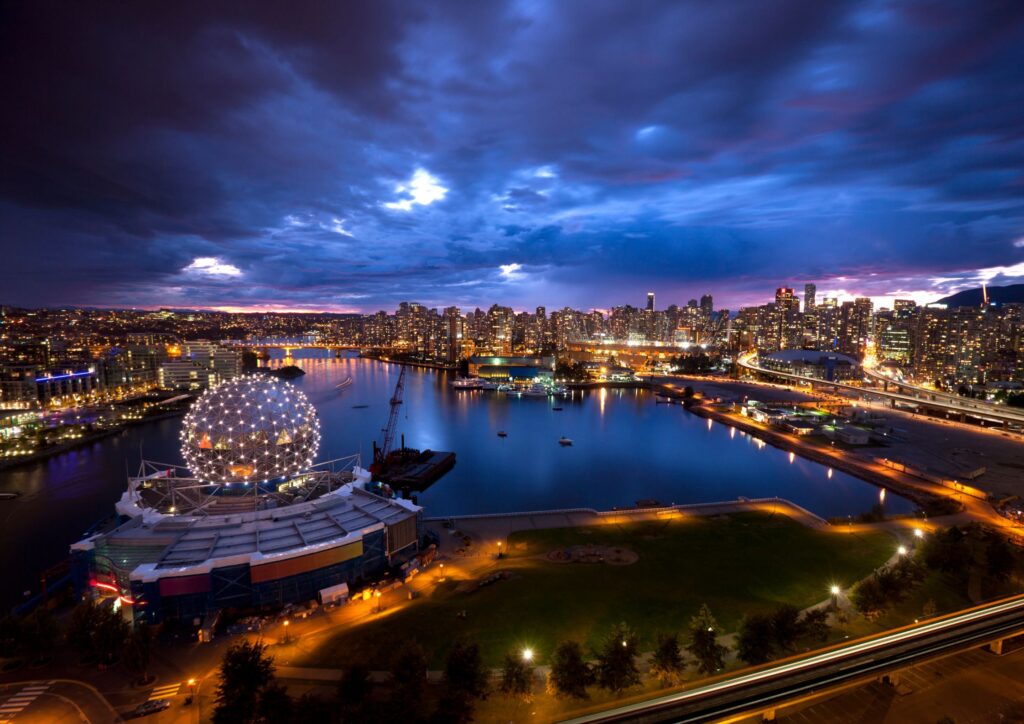
Vancouver, a dynamic coastal metropolis, captivates with its stunning landscapes, cultural richness, and diverse real estate opportunities. Embrace the breathtaking backdrop of mountains and ocean as you explore vibrant neighborhoods offering everything from luxurious condos to historic homes. Indulge in world-class dining, diverse arts, and outdoor adventures. Vancouver is renowned for top-tier schools, a thriving economy, and a multicultural atmosphere. Enjoy a lifestyle that seamlessly integrates urban sophistication with natural beauty. From Stanley Park’s lush trails to the bustling energy of downtown, every corner holds a unique experience. Vancouver is more than a city; it’s a lifestyle choice—a vibrant, inclusive, and progressive community where dreams take root. Discover your perfect home in this Pacific gem and immerse yourself in the unparalleled allure of Vancouver living.
Explore Our Top Home Selections
Our featured listings showcase homes selected for their distinct qualities, designed to match a wide range of personal preferences and needs.
City market at a glance with key stats on sales, listings, prices providing essential insights for your real estate journey.
| Year |
Avg. Sold Price |
Avg. Days On Market | Avg. Price / Sqft |
Total Inventory |
Number of New Listings | Sales / Active Ratio | Sales |
|---|---|---|---|---|---|---|---|
| 2023 | $2,970,197 | 33 | $1,061 | 1,006 | 3,643 | 14.5% | 1,742 |
| 2022 | $2,895,965 | 30 | $1,068 | 1,166 | 4,1461 | 12.5% | 1,745 |
| Year |
Avg. Sold Price |
Avg. Days On Market | Avg. Price / Sqft |
Total Inventory |
Number of New Listings | Sales / Active Ratio | Sales |
|---|---|---|---|---|---|---|---|
| 2023 | $1,392,651 | 26 | $1,040 | 291 | 1,507 | 19.9% | 691 |
| 2022 | $1,415,147 | 21 | $1,052 | 290 | 1,538 | 21.0% | 714 |
| Year |
Avg. Sold Price |
Avg. Days On Market | Avg. Price / Sqft |
Total Inventory |
Number of New Listings | Sales / Active Ratio | Sales |
|---|---|---|---|---|---|---|---|
| 2023 | $937,978 | 28 | $1,100 | 1,844 | 9,861 | 21.5% | 4,695 |
| 2022 | $946,347, | 23 | $1,104 | 1,802 | 10,254 | 25.2% | 5,369 |
Special agents in real estate, our team brings construction, design, and marketing prowess to Vancouver’s market, prioritizing unparalleled service.
Stay ahead with our market updates. From current trends to future predictions, we provide all the essential insights you need to navigate the real estate landscape effectively.

Rent or Buy in Vancouver To Rent or Buy in Vancouver is a common question we receive from our buyers and it’s actually a really hard
Stay Up To Date
Share your real estate journey with us. Write a review of The Macnabs on Google and help others find their perfect home!
Copyright © 2024 The Macnabs. All rights reserved.
The data relating to real estate on this web site comes in part from the MLS Reciprocity program of the Real Estate Board of Greater Vancouver or the Fraser Valley Real Estate Board. Real estate listings held by participating real estate firms are marked with the MLS Reciprocity logo and detailed information about the listing includes the name of the listing agent. This representation is based in whole or part on data generated by the Real Estate Board of Greater Vancouver or the Fraser Valley Real Estate Board which assumes no responsibility for its accuracy.